Projects
The Center for Spatial Planning Analytics and Visualization undertakes a vast number of research projects across a variety of disciplines. Our expertise lies in our ability to analyze, extract, and present complicated location-based information to end users across multiple digital environments. Our results ultimately help our sponsors make informed science-based decisions on a given topic.
Here you will find many of our projects from the past few years. Besides presenting our research results in journal articles, reports, and elsewhere, delivery to sponsors sometimes comes in the form of an online, interactive map application or data visualization tool. Some are on this page, but you will find more examples on our Interactive Maps and Tools page.
Sustainable Urbanization
Atlanta Community Resilience
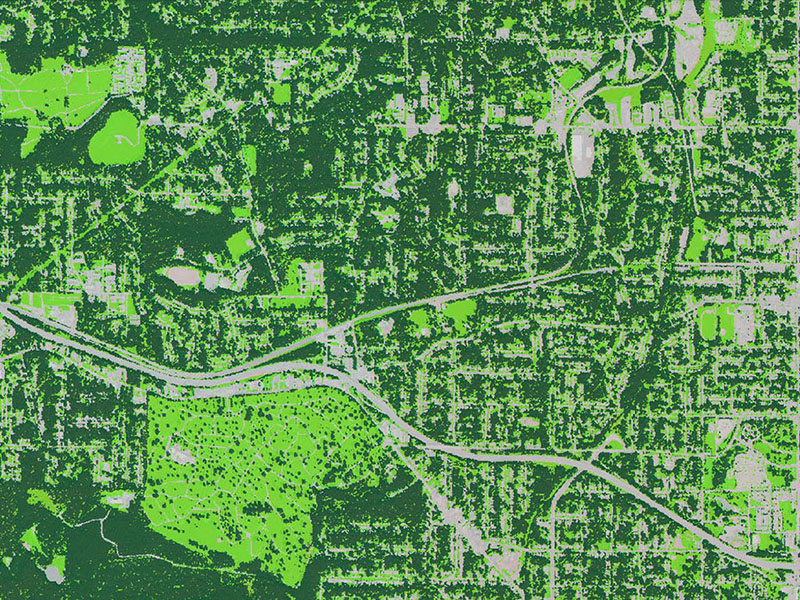
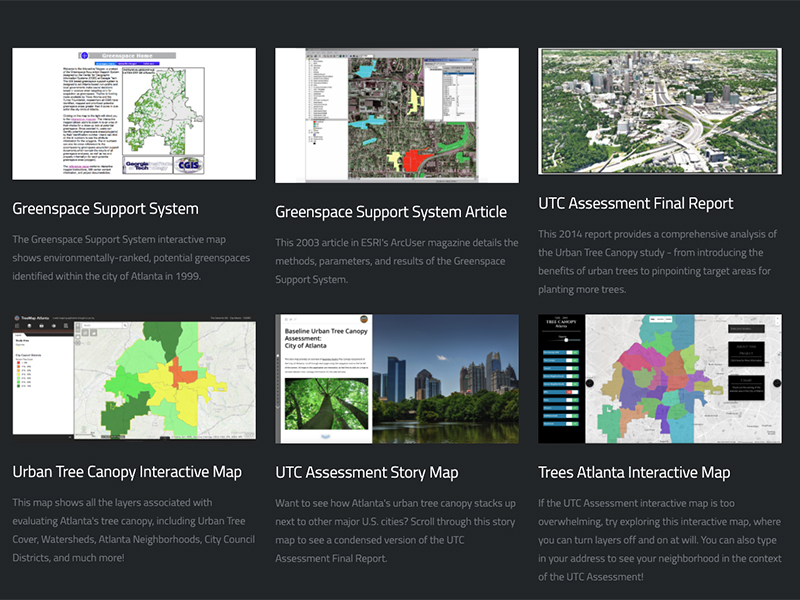
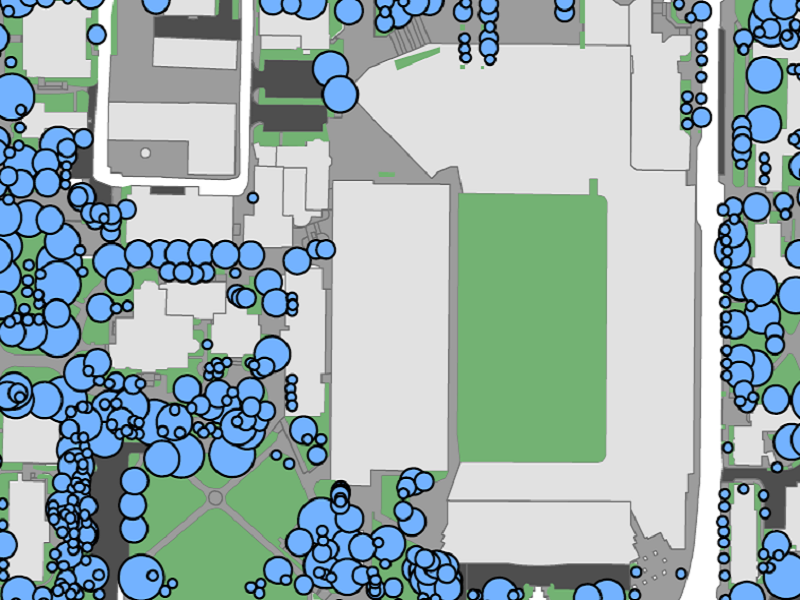
Assessing Urban Tree Canopy


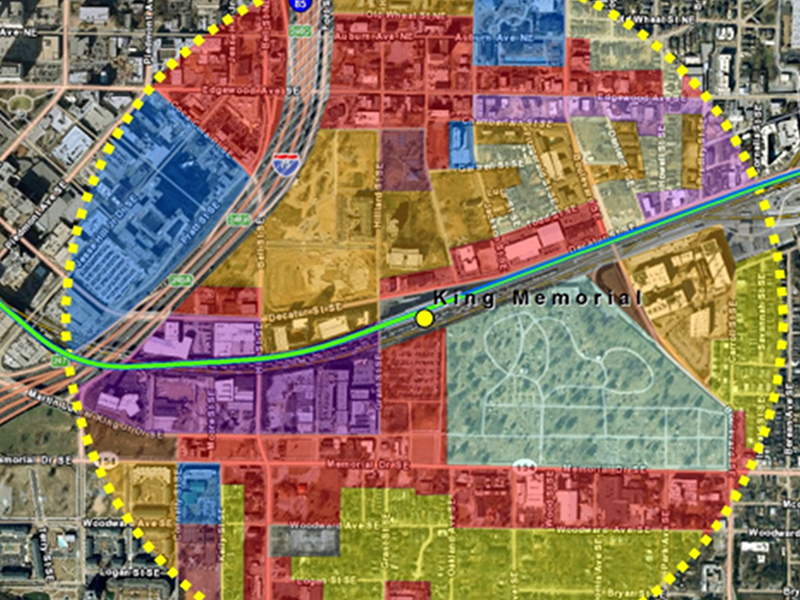
Tracking the Atlanta Streetcar
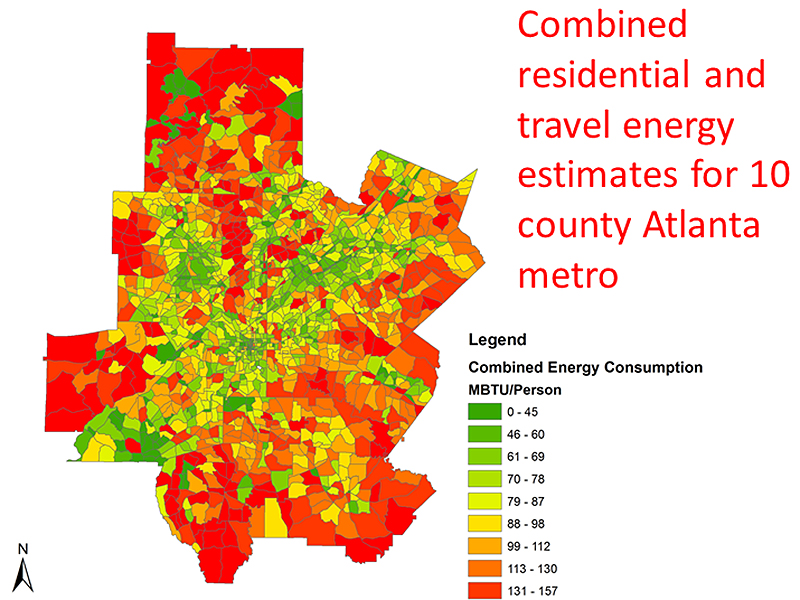
Urban Form and Energy Index
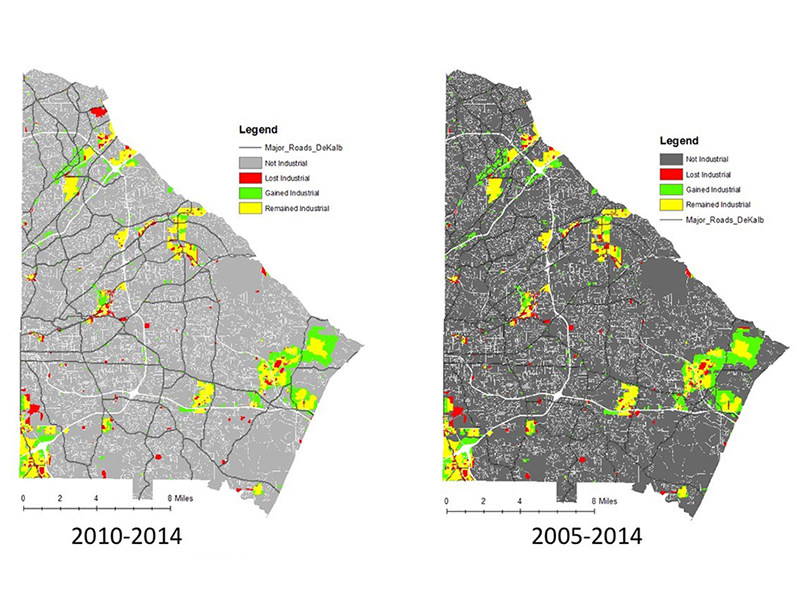
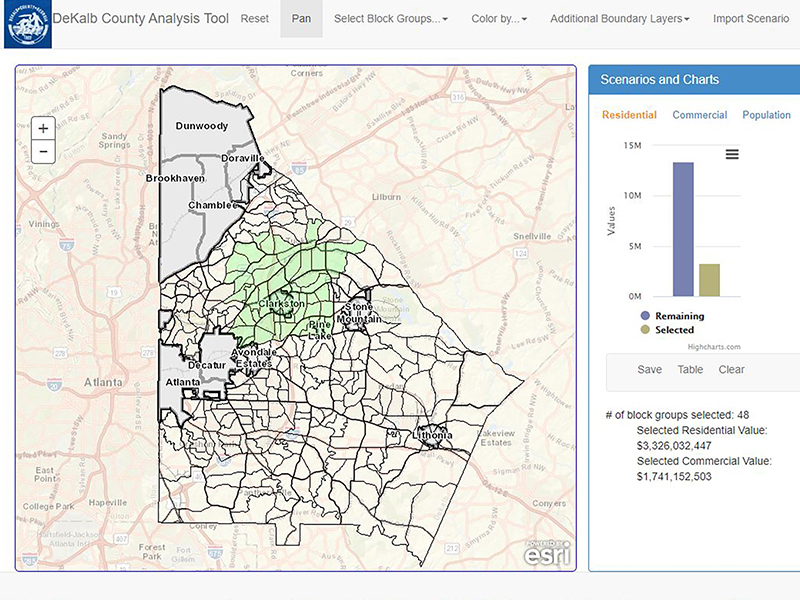
DeKalb Industrial Land and Economy Study
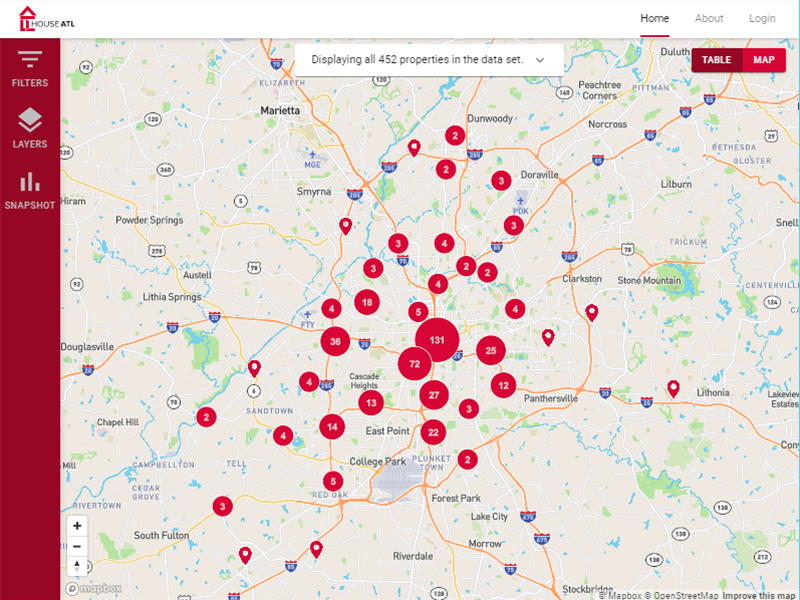
HouseATL Data Collective
Greenspace Support
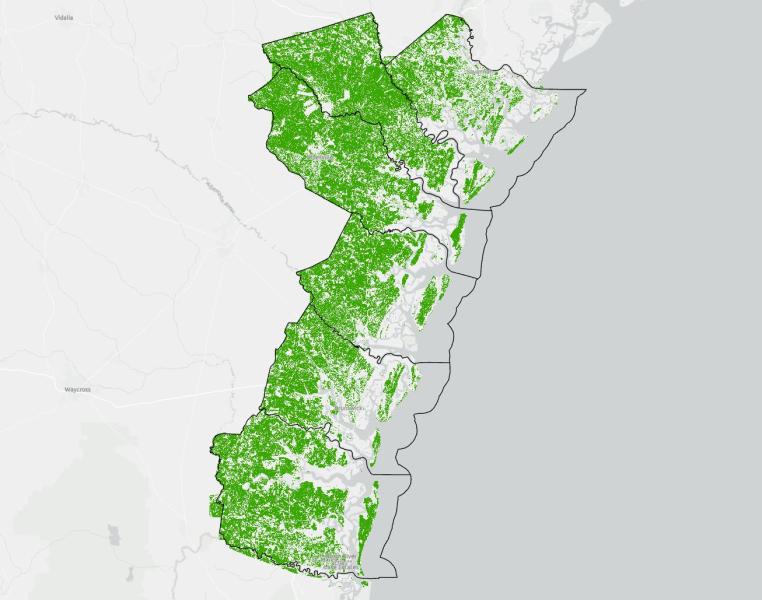
Georgia's Coastal Tree Canopy
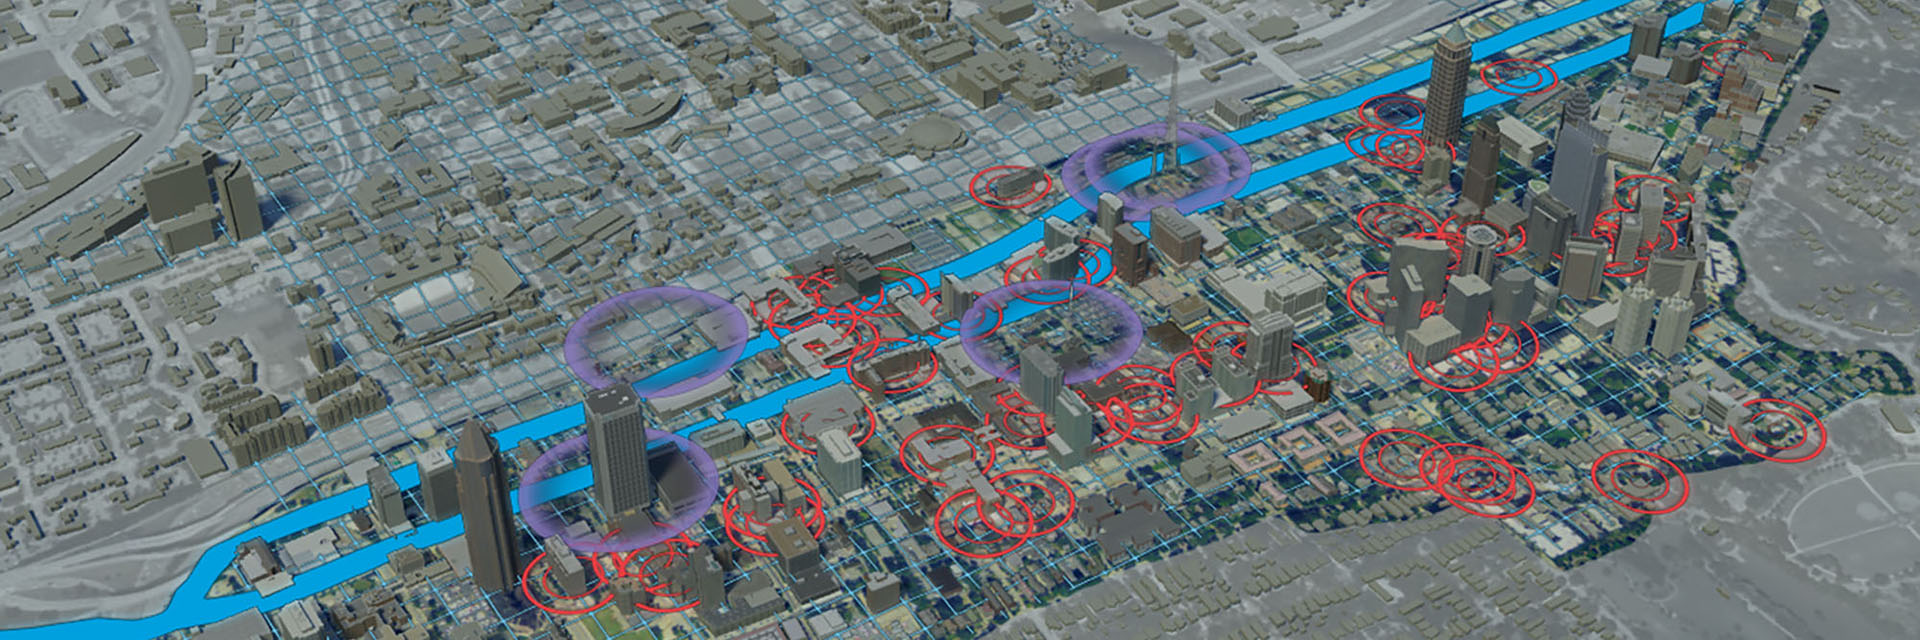
Immersive Visualization and Simulation
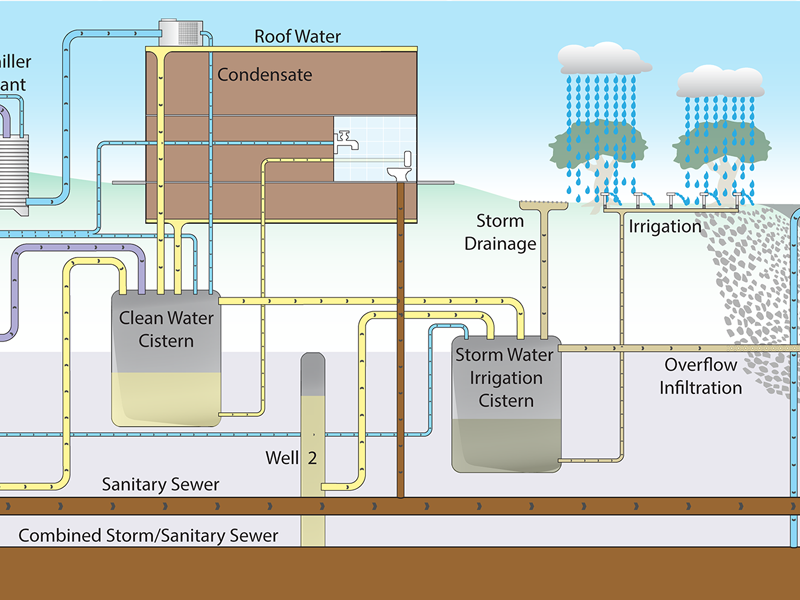
Storm Water Management


Arboretum
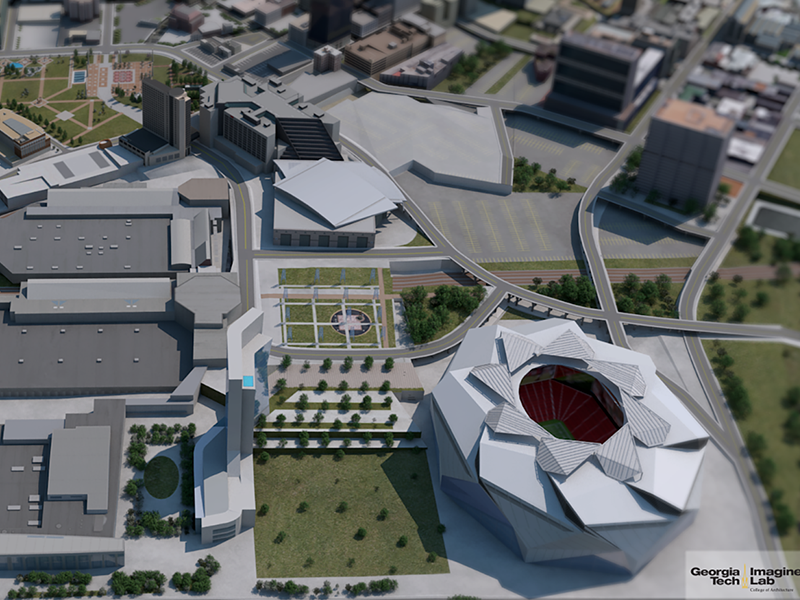
Georgia World Congress Center Visualization
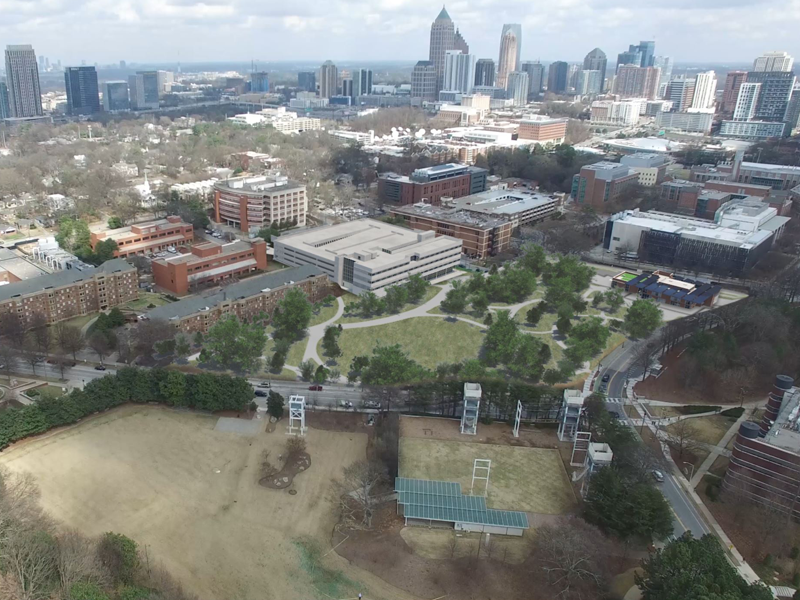
3D visualization of Eco Commons and Campus Center
CampusVR

GT Eco-Tour
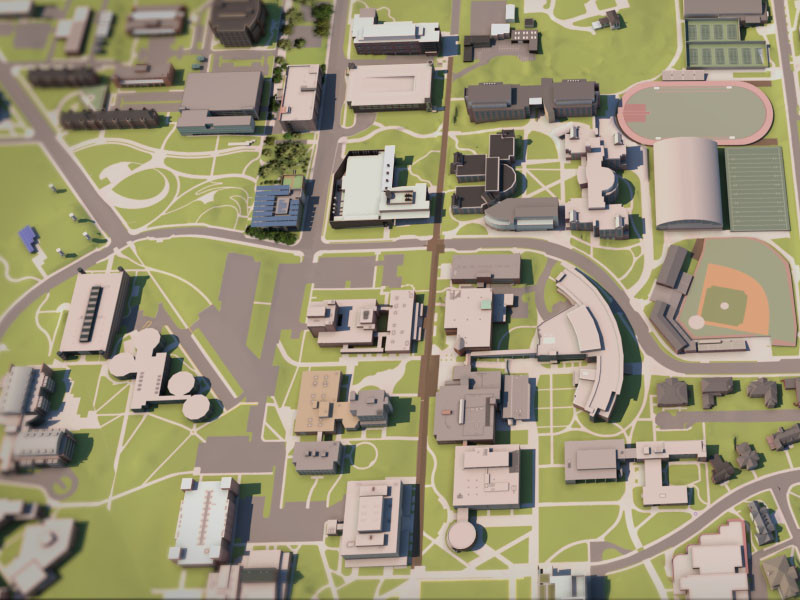
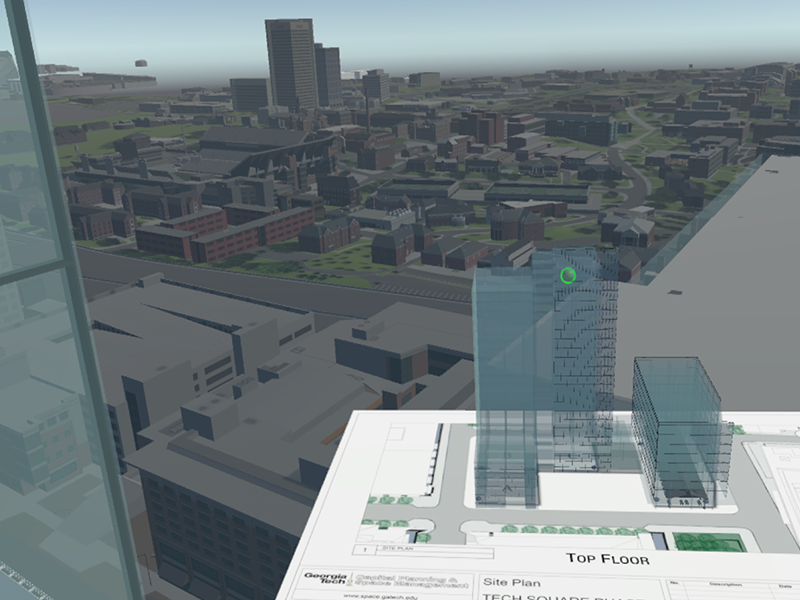
3D Campus Update
Planning Support
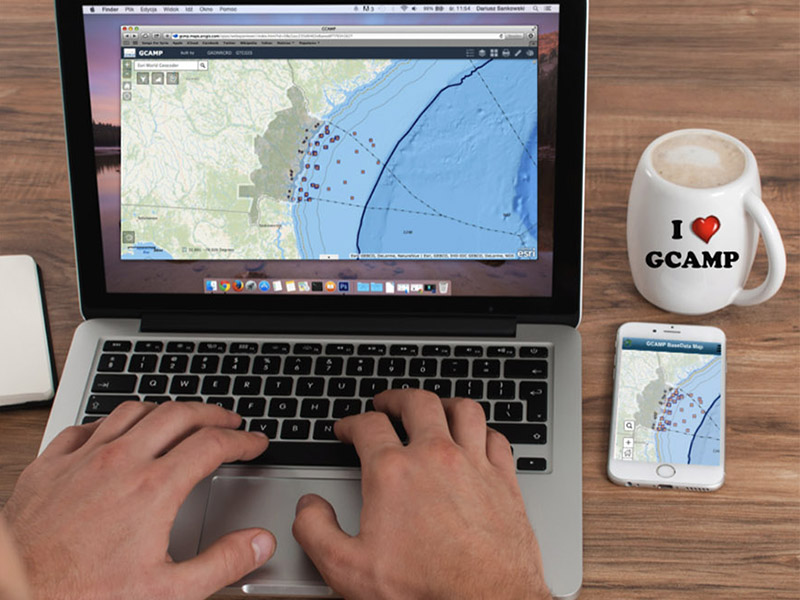
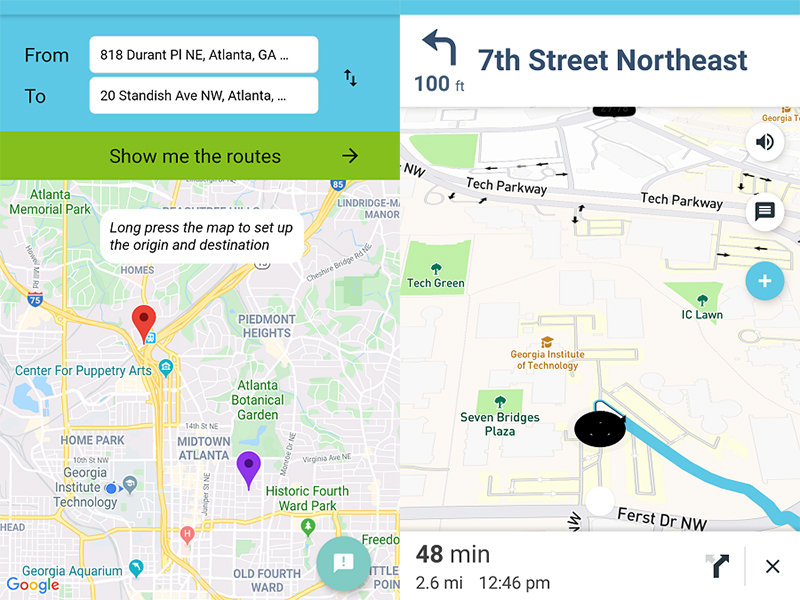
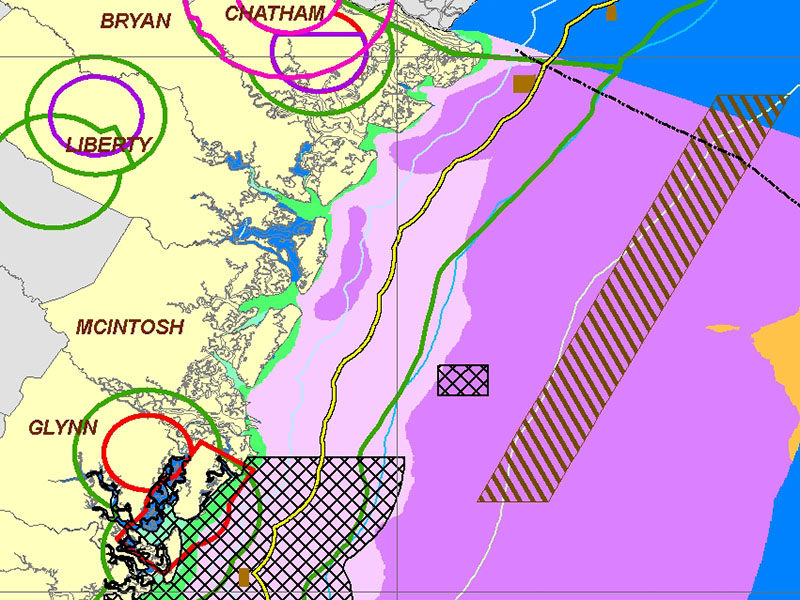
Georgia Coastal and Marine Planner
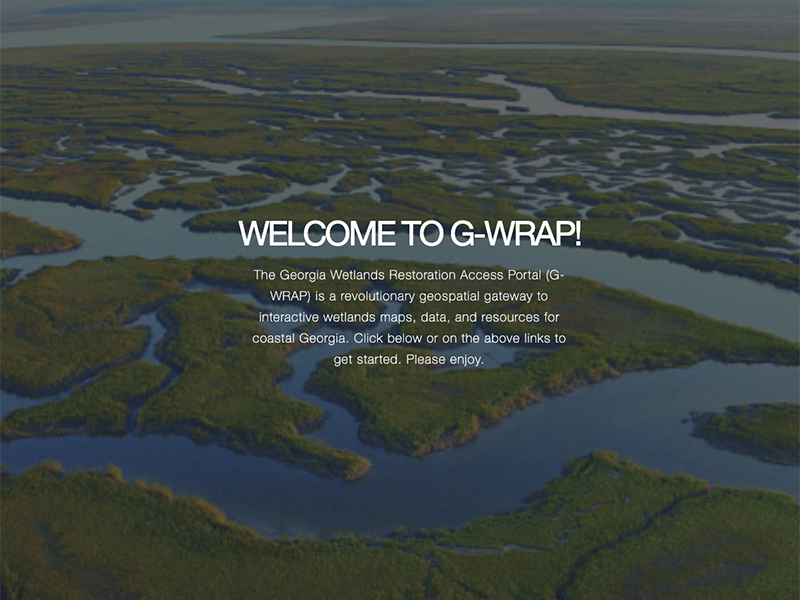
G-WRAP
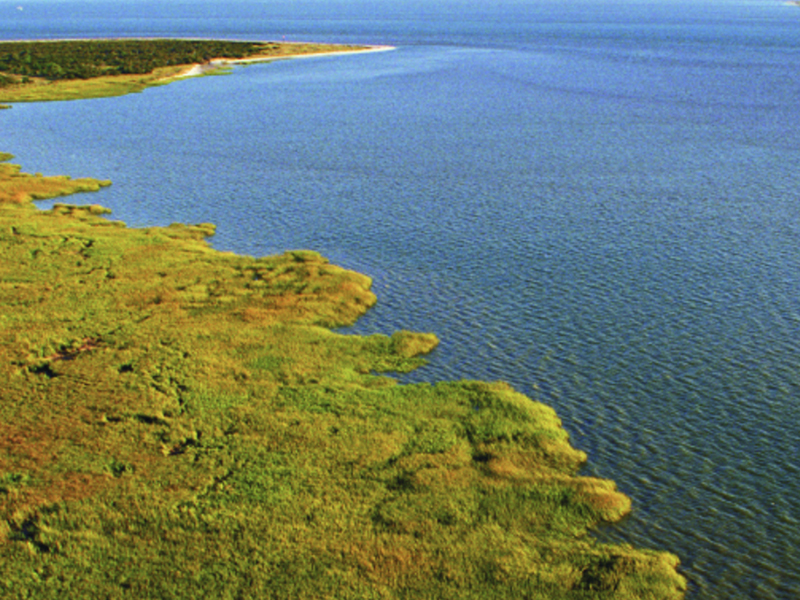
Georgia Wetlands Toolkit

Conserving Mountain Gorillas in Rwanda
ALIGN
Offshore Renewable Energy Potential
Urban Forest Management
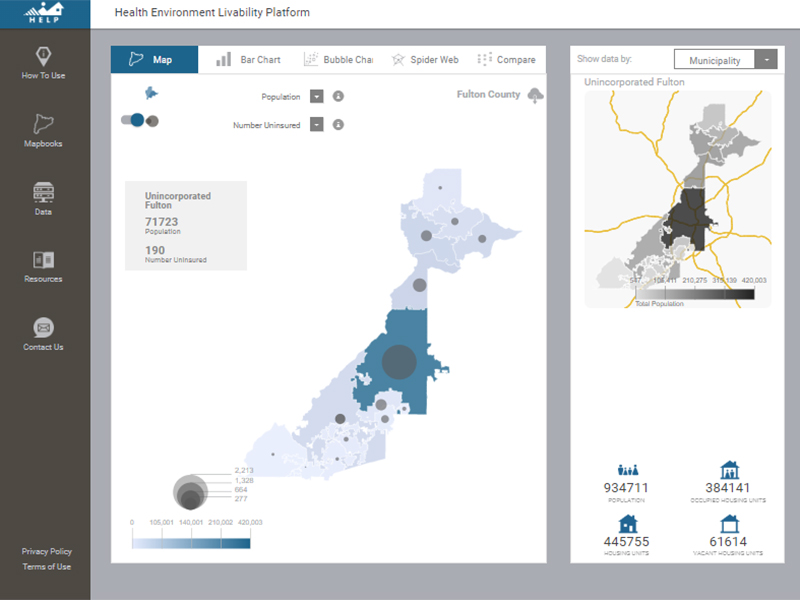
HELP for Fulton County Cities
Municipal Incorporations
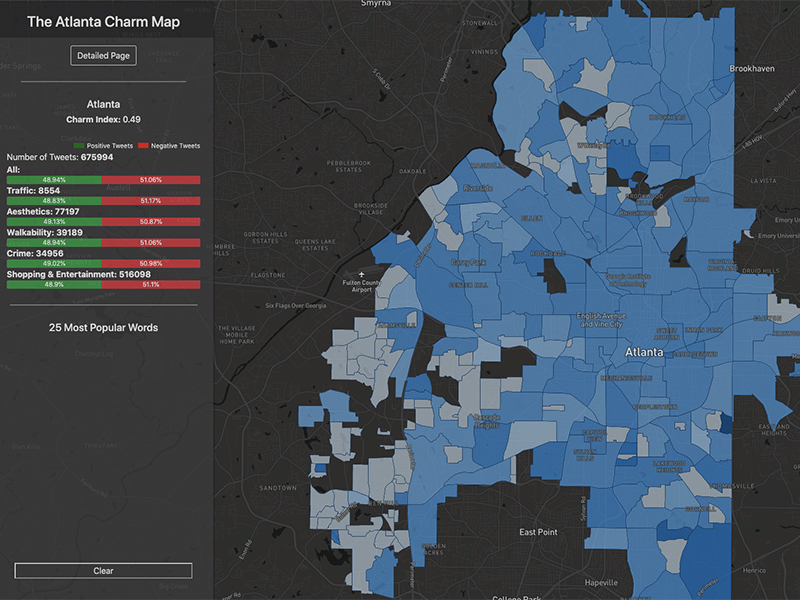
Atlanta’s Charming Neighborhoods
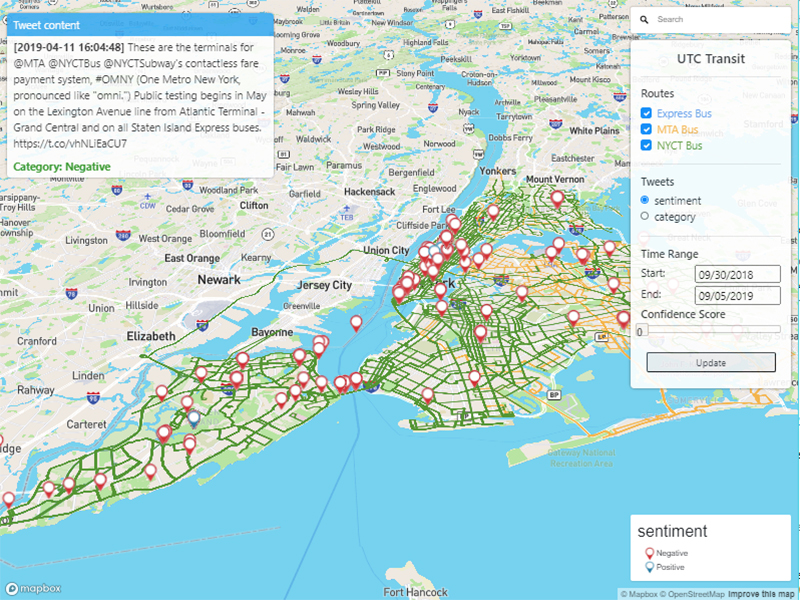
Social Media Analysis for Transit Assessment
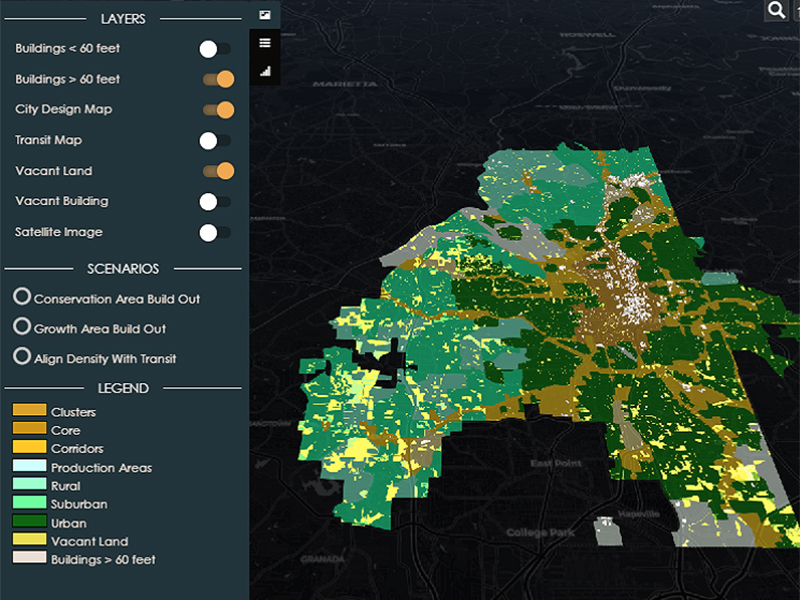
Atlanta City Design
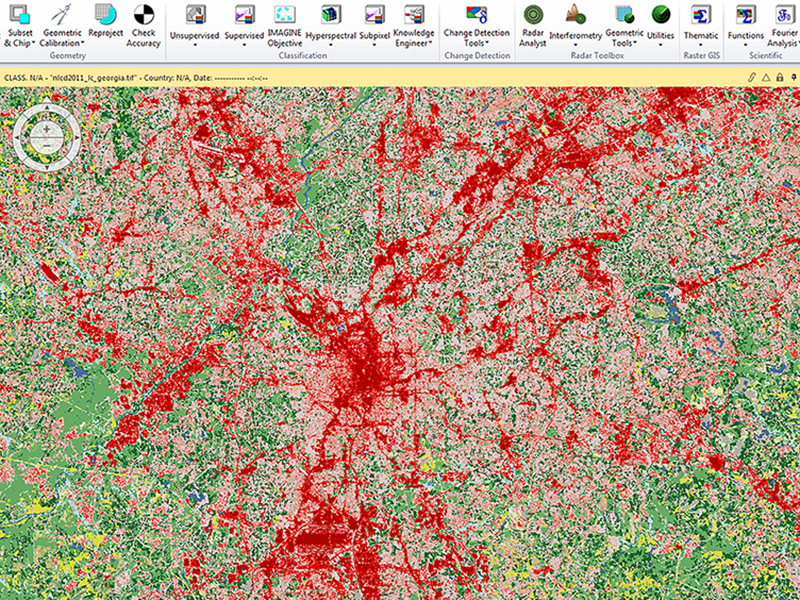
Historic Land Cover Change in Georgia
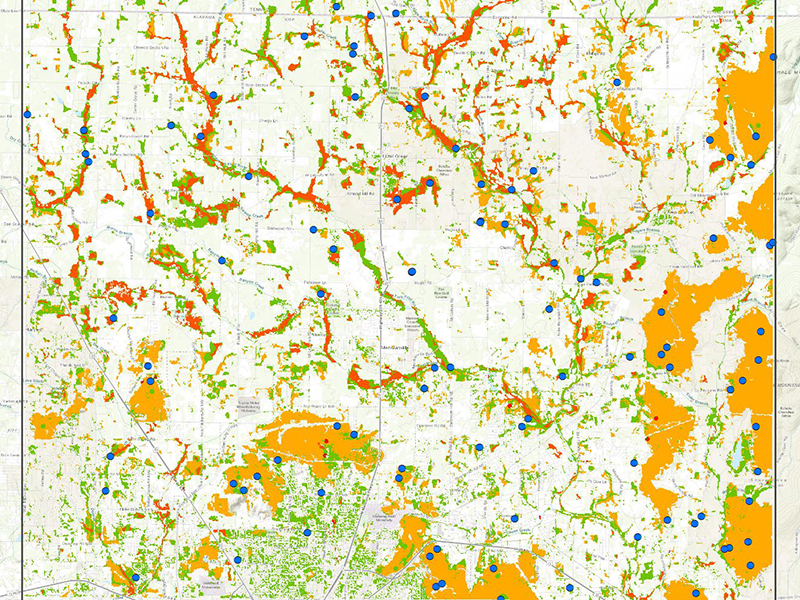
GIS Desktop Wetlands Identification
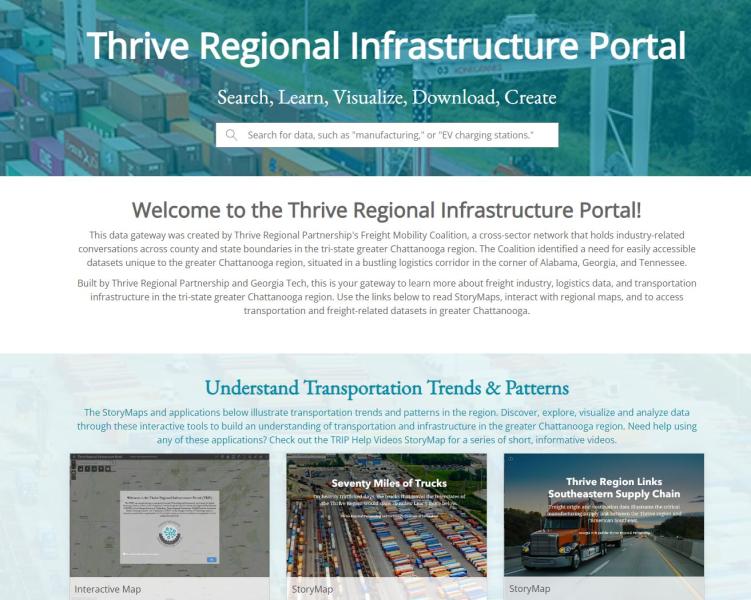
Thrive Regional Infrastructure Portal
Image and Data Processing
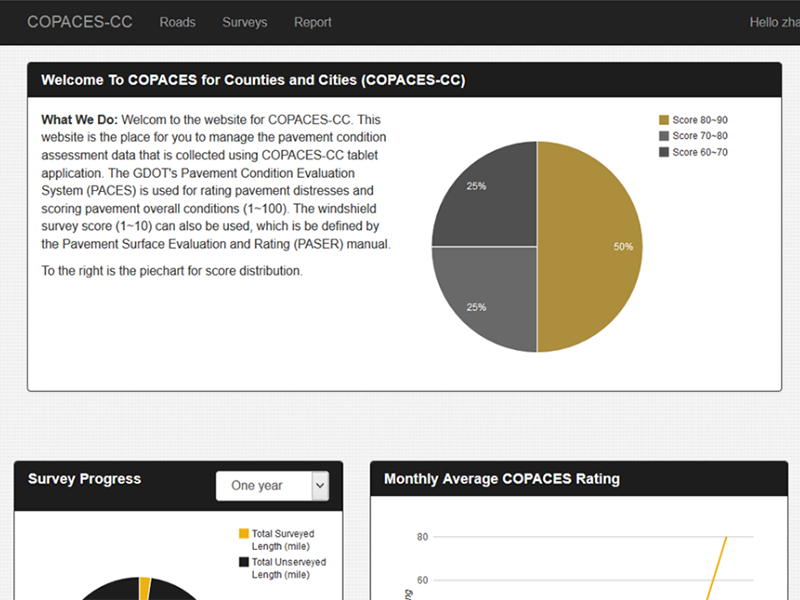
COPACES
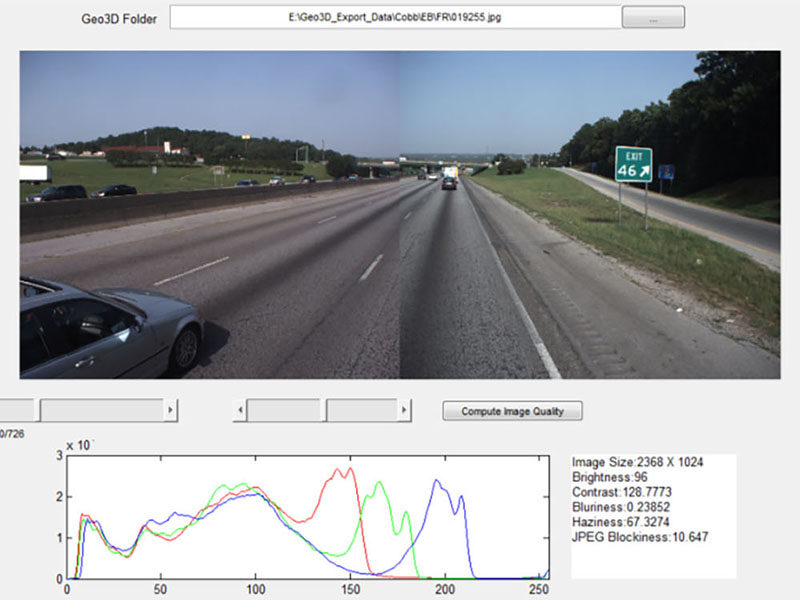
Managing Pavement Assets
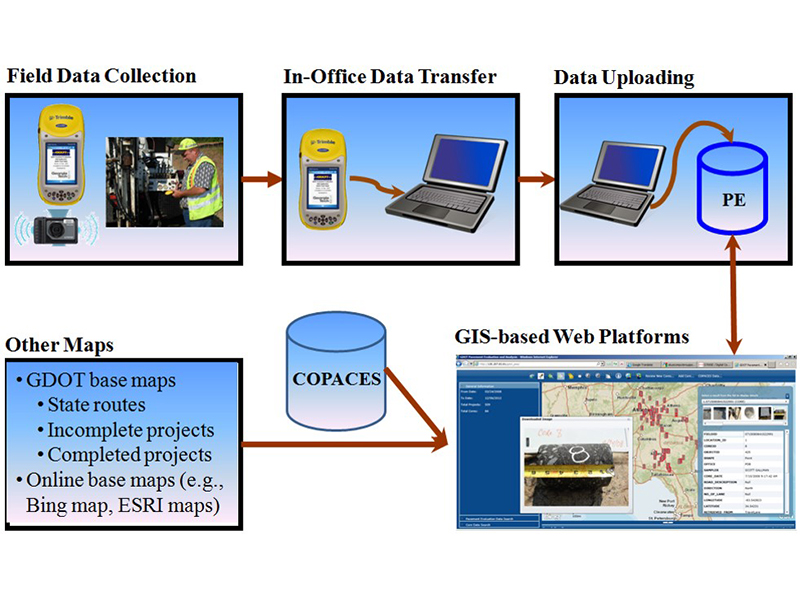
Pavement Management Strategies
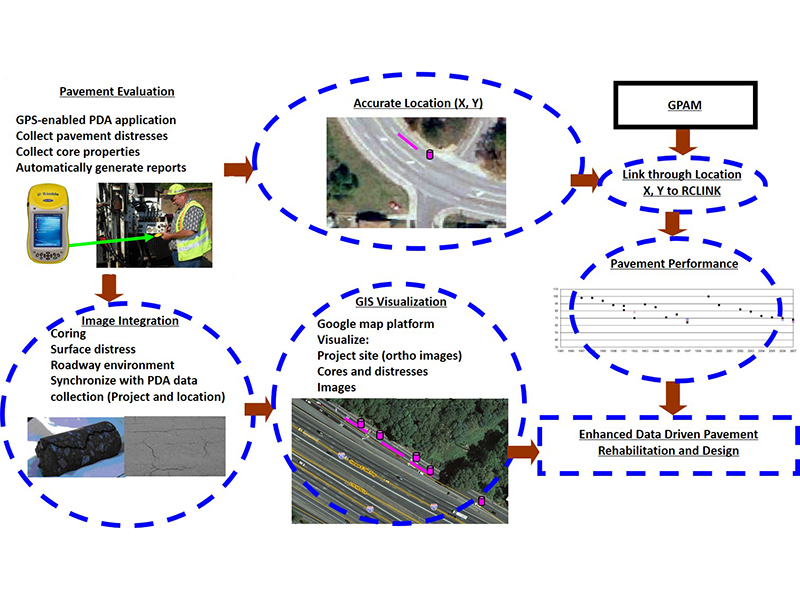
Enhancing GDOT's Pavement Design
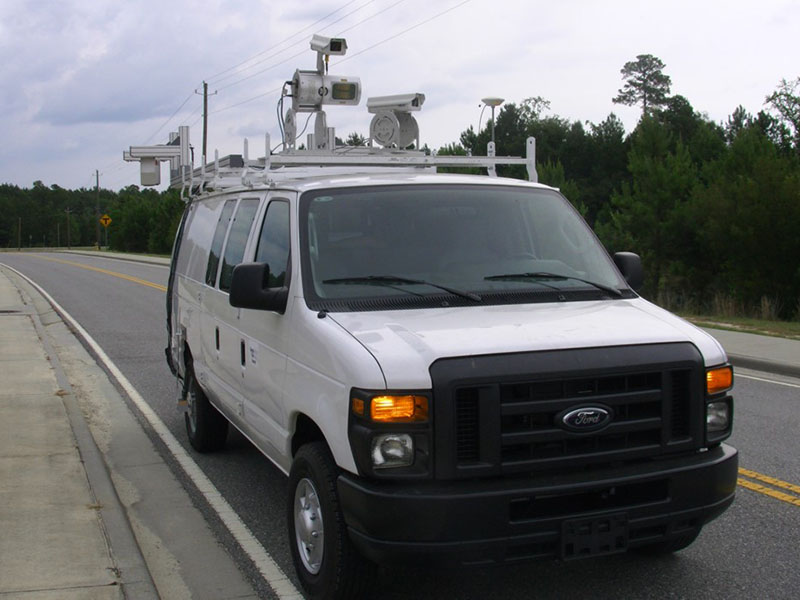
Remote Sensing GAMS
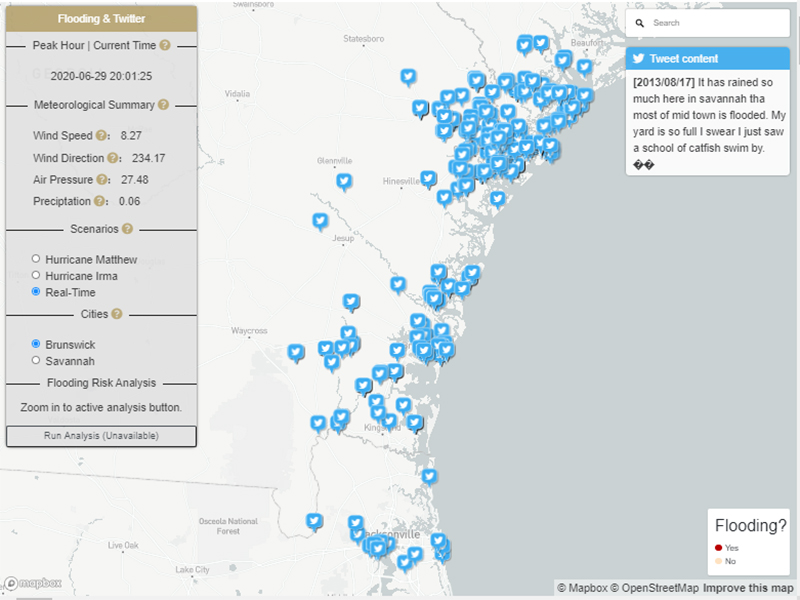
Real-Time Flood Risk Modeling